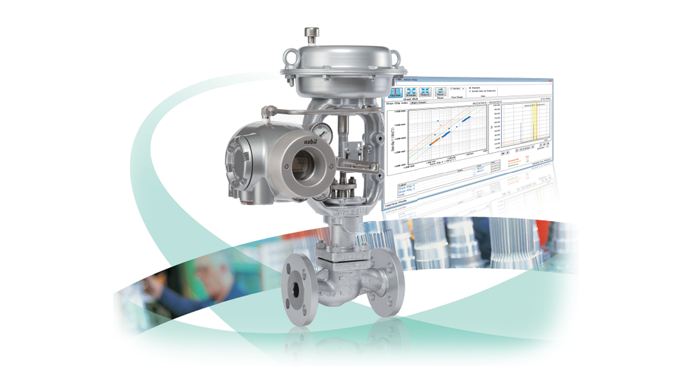
This is a control valve maintenance support system that supports the efficiency of maintenance work by online trend monitoring of the diagnostic parameters of the smart valve positioner during plant operation.
PLUG-IN Valstaff is a control valve maintenance support system designed to perform online trend monitoring of diagnostic parameters for Azbil Corporation's smart valve positioners during plant operation.
PLUG-IN Valstaff monitors diagnostic parameters of control valves around the clock, 365 days a year by communicating with smart valve positioners compatible with FOUNDATION Fieldbus or the HART communications protocol. The diagnostic data helps detect control valve failures and facilitates preventive measures for any problems caused by such failures. In this manner, the system ensures continuous operation of the plant in a safe and reliable manner.
In addition, PLUG-IN Valstaff supports swift and accurate startup by automating both step response testing and the adjustment of the positioner according to the characteristics of the control valve. Moreover, the system facilitates optimized maintenance planning according to the extent of deterioration and the overhaul of control valves by providing indicators of their condition based on the diagnostic data obtained during operation and the step response testing conducted after shutdown.
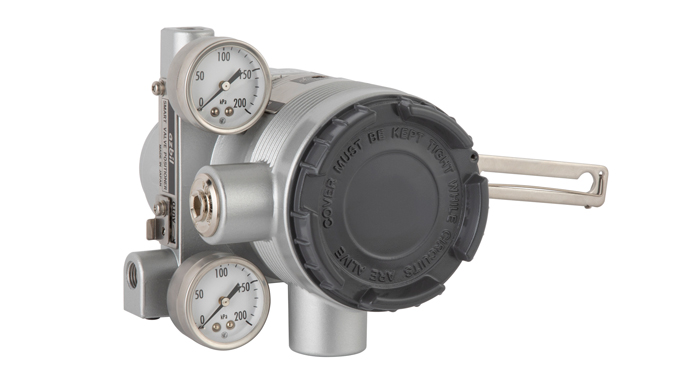
PLUG-IN Valstaff works with Azbil's device management system (InnovativeField Organizer) or PRM® (Plant Resource Manager), an integrated device management package developed by Yokogawa Electric Corporation.
FOUDATION™ fieldbus is supported only when PLUG-IN Valstaff runs on the integrated device management package PRM (Plant Resource Manager) manufactured by Yokogawa Electric Corporation.
* FOUNDATION Fieldbus is supported only when PLUG-IN Valstaff operates on Plant Resource Manager (PRM).
Features
Online trend monitoring of numerous control valves
The extent of deterioration of control valves can be estimated and abnormalities can be identified online during plant operation by collecting diagnostic parameter data from smart valve positioners and displaying it in charts.
Step response test
A step response test can be performed with PLUG-IN Valstaff when the plant is not operating. The results can be displayed in charts and compared with the results from previous periodic repairs so as to identify any deterioration or nonconformance of control valves from the changes in response waveforms. The quantitative data on dynamic characteristics obtained from the test (including time constants, lag time, and settling time) are effectively used for evaluating the performance of control valves. The test can be automatically performed on multiple control valves. The necessary time for periodic repair work can be shortened by running tests on numerous valves at night.
Auto Setup
The auto setup function available with PLUG-IN Valstaff automatically adjusts the positioner. The behavior of the control valve can be monitored during auto setup to check for any abnormalities during the automatic adjustment process.
The stroke time and hysteresis data measured during auto setup can be compared with the data from times when auto setup was run in the past in order to easily estimate the extent of deterioration and identify any abnormality of the control valve.
Functions
- Online trend monitoring of control valves
Diagnostic parameter data from the smart valve positioner is collected while the plant is operating in order to display diagnostic charts that facilitate estimation of the degree of deterioration of control valves and identification of any abnormalities.
- Total stroke
The travel of the valve stem is totaled. - Shut-off count
The number of times the control valve closes fully is chronologically displayed in a chart.
This number serves as an indicator of wear and plastic deformation of the seat ring of the control valve. - Cycle count
The number of times the control valve's movement reverses direction is chronologically displayed in a chart.
The number serves as a diagnostic indicator for sliding parts and the gland packing. - Travel histogram
The frequency of valve operation in particular travel ranges is represented in relation to the total number of valve operations in all ranges of travel.
The value serves as an indicator for checking the adequacy of the valve sizing, detecting clogging inside valves and piping, and predicting trim damage caused by operation at a small degree of opening. - Maximum travel speed
Working speeds towards both the open and closed positions are constantly measured by the positioner, and trends in maximum speed in both directions are displayed chronologically.
This information helps to identify deterioration of the gland caused by sliding motion, deterioration of parts that guide the actuator, and air leakage from the actuator. - Stick-slip diagnostics
A judgment is made regarding the tendency for stick-slip movement.
This serves as an indicator for identifying, for example, gland deterioration caused by sliding, sticking of guide parts, and warping of the trim. - Deviation
Data on the travel setting of the control valve and the actual travel is collected and displayed in a chart.
This information serves as the most basic indicator for telling if the operating characteristics of the control valve are good or poor.
Inquiries